The PDC Image Database contains coins with Sellwood type numbers from 1.1 to 90.2, and there are data on 15,575 individual coins (charted as "Coins in Database") . The data have been accumulated by Chris Hopkins during visits to the major museum collections, from numismatic literature and commercial sales. These examples include at least one example of every coin listed by David Sellwood in An Introduction to the Coinage of Parthia (2nd ed., 1980). The data set is constantly increasing and, as it grows, it will yield more accurate analysis. If you have information on unpublished coins, please contact Chris Hopkins to add them to the database.
Note: The data is only representative and is a slice extracted form the database on 14 February 2005.
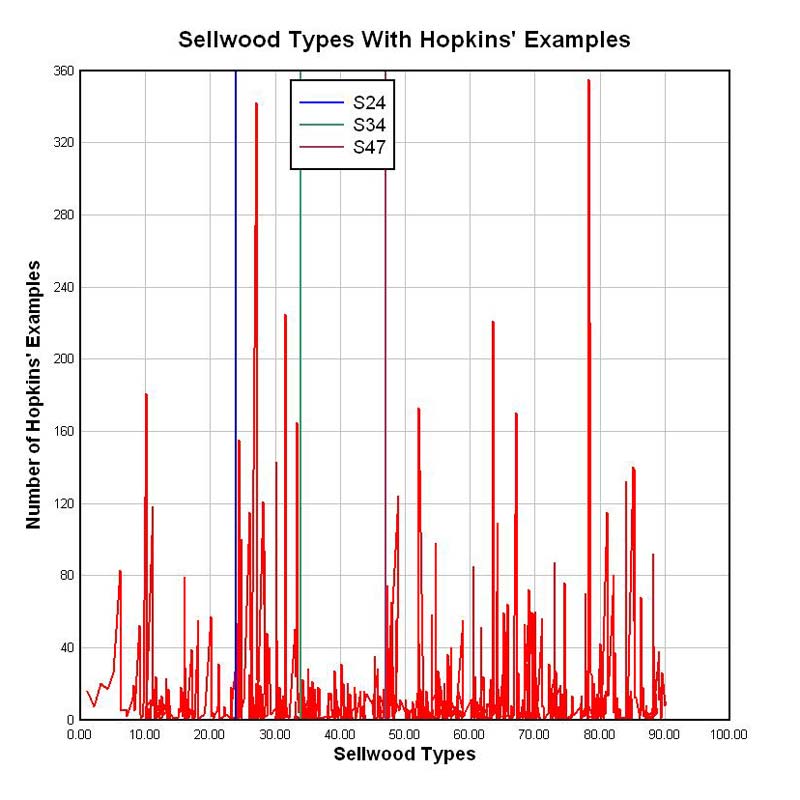
Statistically, the mean of the data set is 9.48 with a standard deviation (s) of 23.88, and a sample variance (s2) of 570.40. The range of data per individual coin is from 0.0 to 355 with a sum of 15,575, and a count of 1,640 Sellwood coin types. As you can see, with a mean of 9.48 the data is skewed because of the anomaly of very-rare to rare coins.
This graph is a composite of Sellwood numbers versus number of coins in the image database as of 14 Feb 2005.
|
 |
|||||||||||||||||||||||||||||||||||||||||||||
|
Click on graph to enlarge |
||||||||||||||||||||||||||||||||||||||||||||||
|
|
|
Click on graph to enlarge |
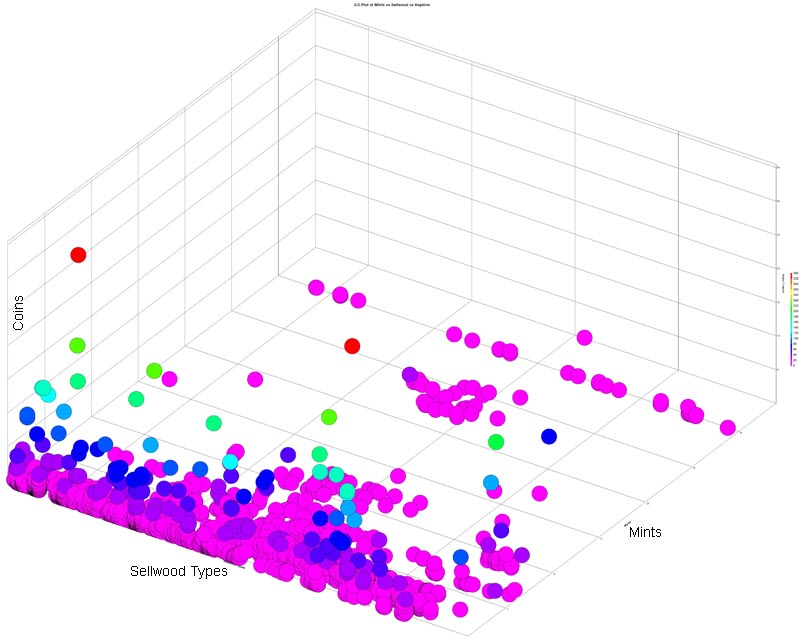
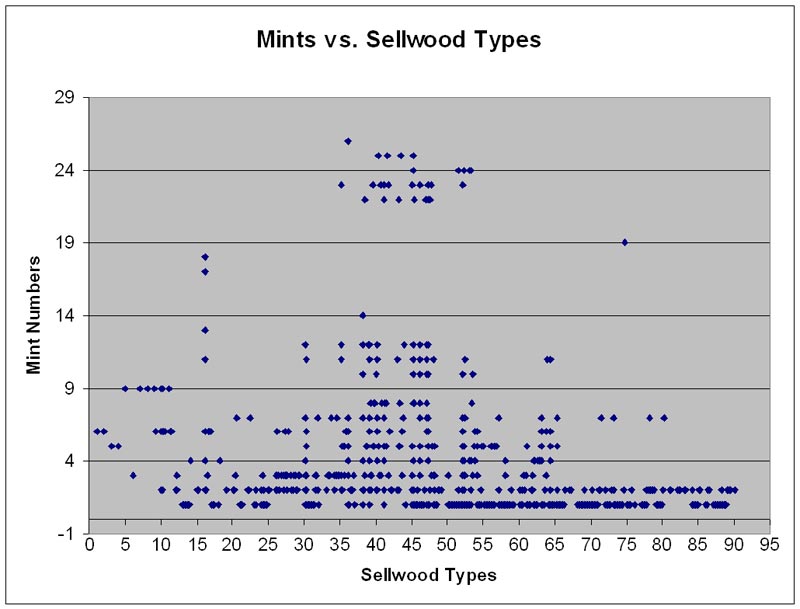
This chart is a plot of the Mints vs. Sellwood types vs. Coins in Database as of 14 Feb 2005. The plot shows the preponderance in the distribution in examples of coins in the mints 1-5. The Y-axis is Sellwood Types, the X-axis is Mint Number, and the Z-axis is Coins in Database. The color scheme is the same as above
 |
|
Click on graph to enlarge |
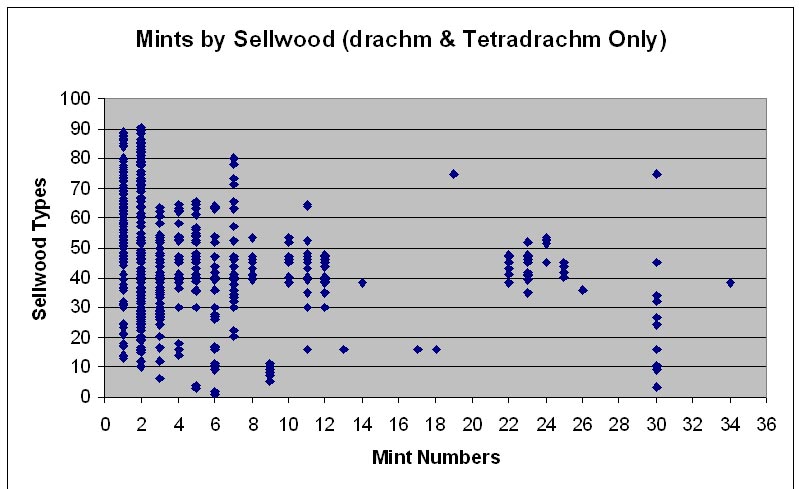
When the database is isolated into a data set of only drachm and tetradrachm coins, it does little to change the appearance of the database. We see a better mean and, when we view the Mint Numbers vs. Sellwood types, we see a definite pyramid shape from S30 to S66 with the greatest variety of coins being maximized within the period of about S35-S55. Most coins were manufactured between S30 and S66. The data indicate that the economical value of the empires tapers off after S66.
Within the interval of S36 to S54 we have the greatest number of mints in operation for the most extended period. This is also the interval where we have the "court at..." mints being used by the Empire. The zone of the least number of active mints is from S66 to S90.2. In fact there are only three significant mints working: Seleucia, Ecbatana, and Margiane. In this interval there is another mint indicated by Sellwood which is Chorasmia (?); however, showing only one single coin makes this mint very odd and makes one wonder if the data is correct. The overall marked continuous activity of multi-Parthian mints is from S31-to-S65. Within the interval of S31-to-S65 are contained 42% of all the database examples, or 5,402 coins (again, drachm and tetradrachm only). The interval from S36-to-S54 contains 2,542 database examples or about 20% of the coins. Another anomaly is that the Sellwood series of the S16.1 to S16.30 coins is unique in that there are 8 mints producing coins from just this one series. This is unique within the interval from S1 to S31.
This graph is a composite of Sellwood numbers versus number of coins in the image database as of 14 Feb 2005.
 |
|
Click on graph to enlarge |
|
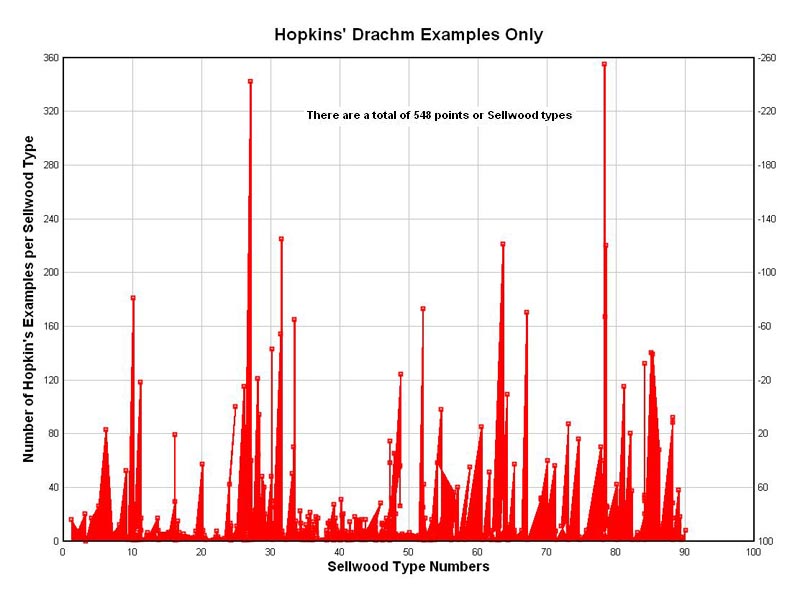
Drachms Only |
|
 |
 |
|
Click on graph to enlarge |
Click on graph to enlarge |
This graph shows the Sellwood types by mints as of 14 Feb 2005. Here the mints are labeled according to the numbers assigned in All Coins. Notice that number 30 is for Sellwood mints marked as "unknown mints." Furthermore, numbers 22-26 are for "Court at..." mints. One can quickly see from this graph the large production of coins at mints one and two (Seleucia and Ecbatana).
 |
|
Click on graph to enlarge |
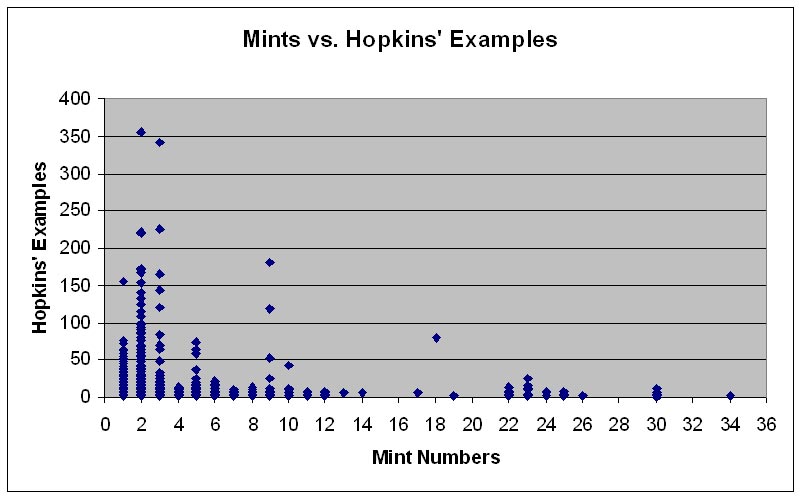
This graph shows the greatest number of examples were minted by the Seleucia (1), Ecbatana (2), and Rhagae (3) mints. Data as of 14 Feb 2005.
 |
|
Click on graph to enlarge |
We note in this graph the triangular shape of the overall drachm and tetradrachm coin distribution during the Parthian era. We can also see the long trend of coin production of the Ecbatana mint (2) and the overall primary production of the Seleucia mint (1) from about Sellwood type 45 to the end of the Empire. Data as of 14 Feb 2005.
 |
|
Click on graph to enlarge |
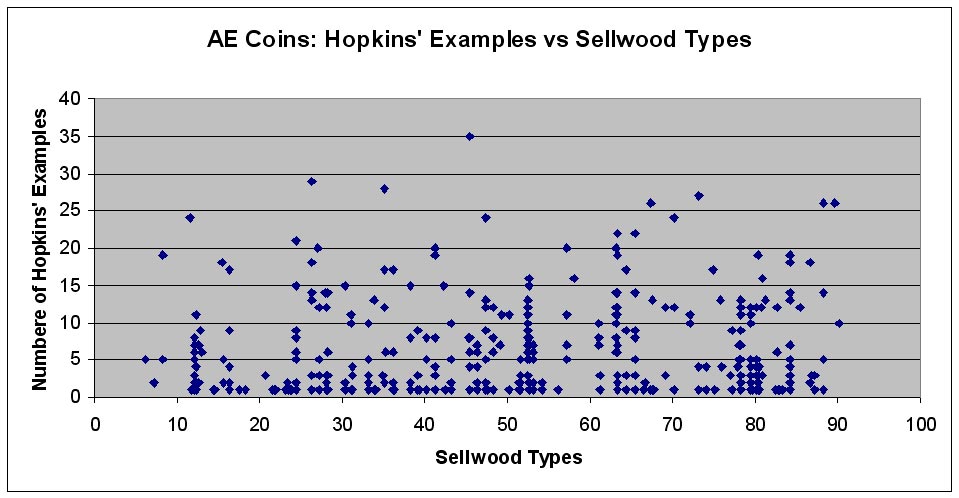
This scatter-graph really highlights the more general distribution of bronze coins as compared to the silver coin distribution. From this graph we can also see the unique periods of strong bronze coin production. Data as of 14 Feb 2005.
 |
|
Click on graph to enlarge |
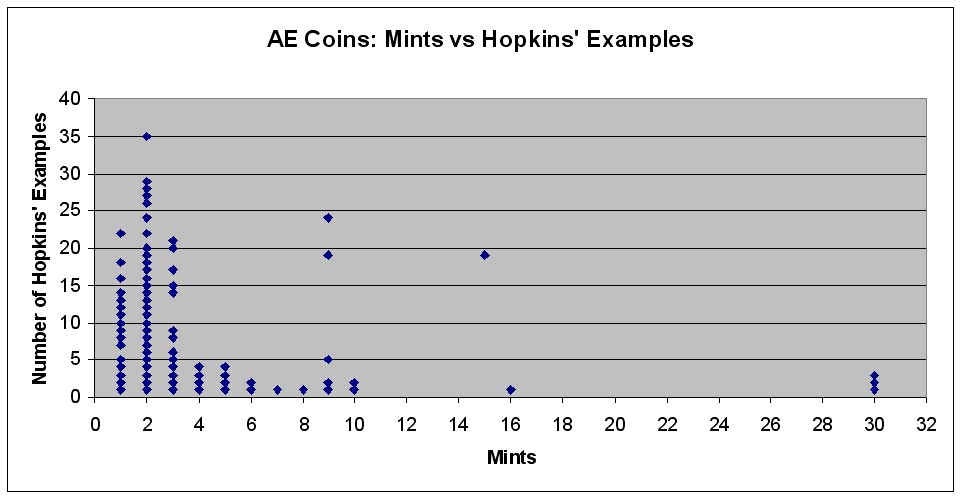
This plot simply lines the Coins vs. Mints. Once, again see that the main producer is from the mint at Ecbatana (2). Data as of 14 Feb 2005.
 |
|
Click on graph to enlarge |
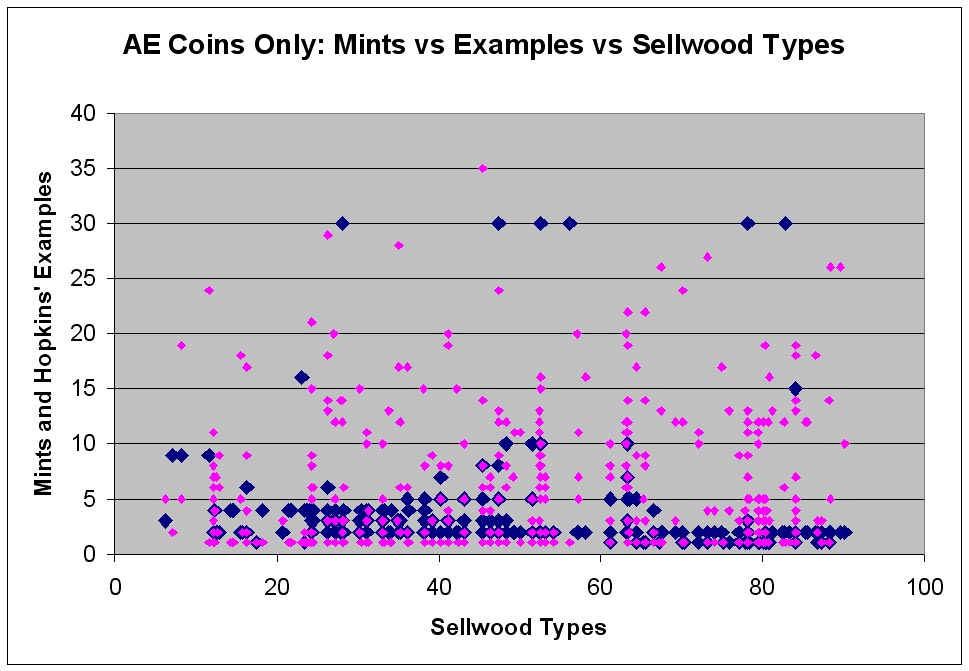
The dark points represent the mints vs. Sellwood bronze types, and the light purple marks are the database examples vs. mints vs. Sellwood bronze types. Data as of 14 Feb 2005.
 |
|
Click on graph to enlarge |
There are seven special groupings that are interesting:
- the S11 and S12 coins
- the S24-S26 coins
- the general grouping of S30-S50 coins
- the S61-S67 coins
- the S78-S84 coins, and
- those coins from the higher number during the middle to late Parthian era
The Sellwood type S52 series is the most productive of all individual AE coins.
Note the preponderance of coins minted early in the Parthian era at Susa (4), then the movement to Rhagae (3) and Ecbatana (2) mints until the middle period of the Parthia Empire. During the last stages of the Empire, the primary minting moves to Ecbatana and Seleucia (1). Obviously, the Ecbatana Mint is the primary minter of AE coins throughout time. The isolated mound at the bottom left, centered at Hekatompylos Mint (9), represents the minting of type S11-S12 and S24-S26 coins. However, note the strong production of later coins within the 10 to 16 numbered mints!
 |
|
Click on graph to enlarge |
It is interesting to speculate but futile to determine the actual total number of coins minted during the entire Parthian Empire. However, one can speculate, however risky. As such, I think the statistics from the database could tell us that Parthia may have minted somewhere between 4 to 8 billion combined drachm and tetradrachm silver coins.
Obviously, there are 2,000 years for Parthian coins to have been reprocessed by the government or from deteriorated, hoarded, or just vanished. If my 4-8 billion wild shot in the dark is anywhere near the truth then what happened to all the other coins? I believe debasement can be the root of one answer. Firstly, I think debasement of coins causes inflation and perhaps even a rise in forgeries; and secondly, this causes a raise in copper and/or brass coinage. Debasement also will cause "good" silver coins (90% plus silver content) to be hoarded or buried by their owners. To call in the old "good" silver coins the government had the ability to demand that all government payments and all debts be paid only in good silver coins. After they received these coins, they were then melted down to produced debased coins from this raw metal. If this is true then we can be blessed that some people hoarded coins. We also can see from the present day coins that degrees of debasement probably happen several times in Parthia. Basically, systematic debasement began in the reign of Orodes II (c. 57 - 38 B.C.). The statistics also indicate that during Phraates IV (c. 38 - 2 B.C.) and Osroes I (c. A.D. 109 - 129) the number of AE coins did increase. As a result, most of the early AR coins were most likely destroyed by the government. The remaining coins were out of the Empire's control or hidden away. When the Sasanian Empire came into being, the destruction of early Parthian coins was again standard operating procedure. The Sasanian apparently tried to increase the worth of their drachm coins and this meant that many of the late Parthian coins were simply turned in to the government for a better currency; albeit, at a lower value.
I understand that the Roman mints had the ability to produced about 400,000 denarii per month per mint and that their dies lasted anywhere from 10,000 to 50,000 coins. From the database, we can see that three mints were the primary minting facilities. If we guesstimate that these mints produced 400,000 coins per month and the other secondary mints (about 6 for all practicality) produced about 100,000 coins each per month then we could have a total mint production of about six-million each year. This times the years of the Empire (@472) we reach a total of about 7-billion coins. To me this would seem rather high since we have too many very-rare silver coins in the Database. This suggests to me that a number of the very-rare coins were in production for only about one month or perhaps only for just a few die-life periods. The Roman data would mean that the average production of most coins required about 240 dies at a production rate of about 7-billion coins. Again this seems high. The 100 to 120 dies would seem a more realistic number based on the frequency of today's occurrences indicating maybe 4-billion total coins produced. From the coins we have photographs of we can speculate on a limited number die makers; hence, a tendency toward the lower number of dies produced. Furthermore, I am including the tetradrachm in these amounts and they most likely were not produced at the same rate as drachms. All of this would most likely strongly decrease the 400,000 per month total silver coin number to something far less than the Roman mint figures of denarii production, forcing estimates of overall production toward a lower numbers.
I would conclude that most of the production of Parthia coins was systematically destroyed by the government because of their debasement policy. I would also imagine that both politics along with the shortage of silver were key elements to debasement. And again, breathing thin air, it would appear that not more than 4-billion total AR drachm and tetradrachm coins were ever minted in Parthia. This figure (or any figure) can be used with the statistical frequency factors derived from Hopkins' Database to give an idea of the total mintage per Sellwood type. This frequency factor also causes one to lower the estimated rate of total production based on the heavy number of very-rare coins.
![]() This chart requires Adobe Flash™. Click the button to get Flash for free.
This chart requires Adobe Flash™. Click the button to get Flash for free.
The image is interactive; to get a pop-up menu on a Macintosh, hold down the Control-shift keys (Control key only on System 8 and below) and click. For Windows, click with the right mouse button anywhere on the image. Choose Zoom In or Zoom Out option from the pop-up menu to see different levels of magnification. Click and drag magnified image within the window using the hand cursor. Choose Show All from the pop-up menu to return the image to the original view.
This page last updated 23 Feb 2021

|
|
|
